CRM Data Analysis and Visualization for Enhanced Decision-Making
In the "CRM Data Analysis and Visualization for Enhanced Decision-Making" project, a comprehensive analysis of five years of CRM data, from May 2018 to 2023, was conducted. By utilizing Power BI, a refined dataset of 444,619 rows and 45 columns was meticulously processed and visualized. This powerful tool facilitated efficient data management, advanced visualizations, and real-time insights, enabling better resource allocation, service optimization, and improved customer satisfaction. The project successfully merged data analytics and visualization, innovatively harnessing Power BI's capabilities for a resounding success in CRM analysis.
Project Objective
This project embarks on a comprehensive journey of CRM data analysis spanning five years, from May 2018 to the present (2023). By meticulously curating the dataset to highlight trends post-January 2021.The resultant refined dataset, brimming with 444,619 rows and 45 columns, opens a treasure trove of insights into customer interactions and service management.
Project Challenges:
- Efficiently managing vast CRM data to glean meaningful insights.
- Navigating intricate data preprocessing, including filtering and categorization.
- Crafting intuitive visualisations that expedite decision-making processes.
Complexities and Innovation:
This project thrived amidst complexities by innovatively merging data analytics and visualisation. The complexities stemmed from the sheer volume of data and the need for multifaceted data preprocessing, while innovation flourished in the form of advanced visualisation techniques and predictive analytics.
The Process
Data Collection:
Aggregating CRM data from diverse sources.
Data Preprocessing:
Filtering data starting from January 2021, categorising service types, and refining the dataset.
Visualisation:
Harnessing the power of Power BI for creating comprehensive visualisations.
Key Metrics:
Analysing request counts, tracking source of creation, unravelling resolution trends, monitoring SLA compliance, unveiling departmental and service-type insights, conducting hierarchical department-section analysis, and more.
Feature Inventory
- Request Count by Service Type
- Complaint Count by Source of Creation
- Request Resolution Trends (Monthly)
- Complaint Count by Month and Service Name
- SLA Compliance by Service Category
- Total Requests by Department and Service Type
- Requests Received by Service Type, Department, and Sections (Hierarchical)
- Source-wise Request Count with Status
- Maximum Requests Handled by Employees
- Top-Performing Employees
- Areas with Maximum Requests
- Request Age vs. SLA Analysis by Department
Power BI Benefits
Power BI serves as the linchpin of CRM analysis, providing several invaluable advantages:
- Efficiency: Swift data import and automated refresh mechanisms.
- Interactive Dashboards: Intuitive and user-friendly interface for effortless exploration.
- Advanced Analytics: Seamlessly incorporates machine learning models for deeper insights.
- Customizability: Tailored visuals and reports to suit specific needs.
- Scalability: Handles large datasets with grace and precision.
- Real-time Insights: Delivers instantaneous updates, enabling real-time, informed decisions.
The Result
This CRM data analysis and visualisation project empowers actionable insights that facilitate superior resource allocation, service optimization, and heightened customer satisfaction. Power BI's dynamic capabilities bestow a substantial advantage in the efficient management of extensive CRM data, surpassing other visualisation tools and ensuring a resounding success story driven by data.
Visual Designs
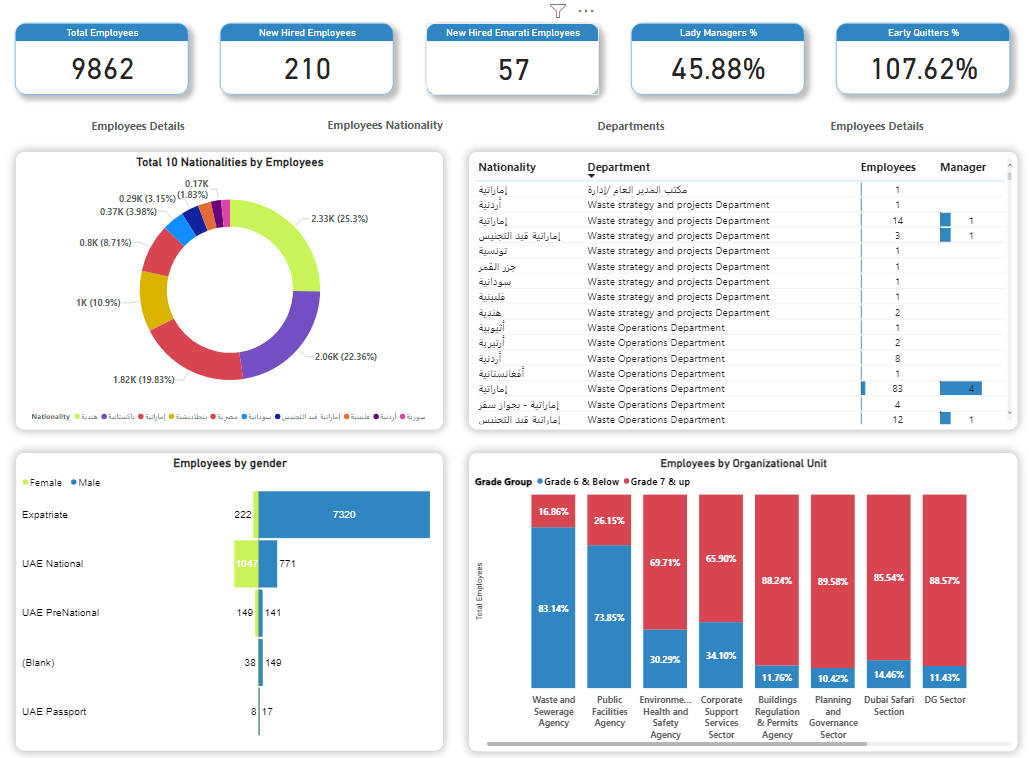
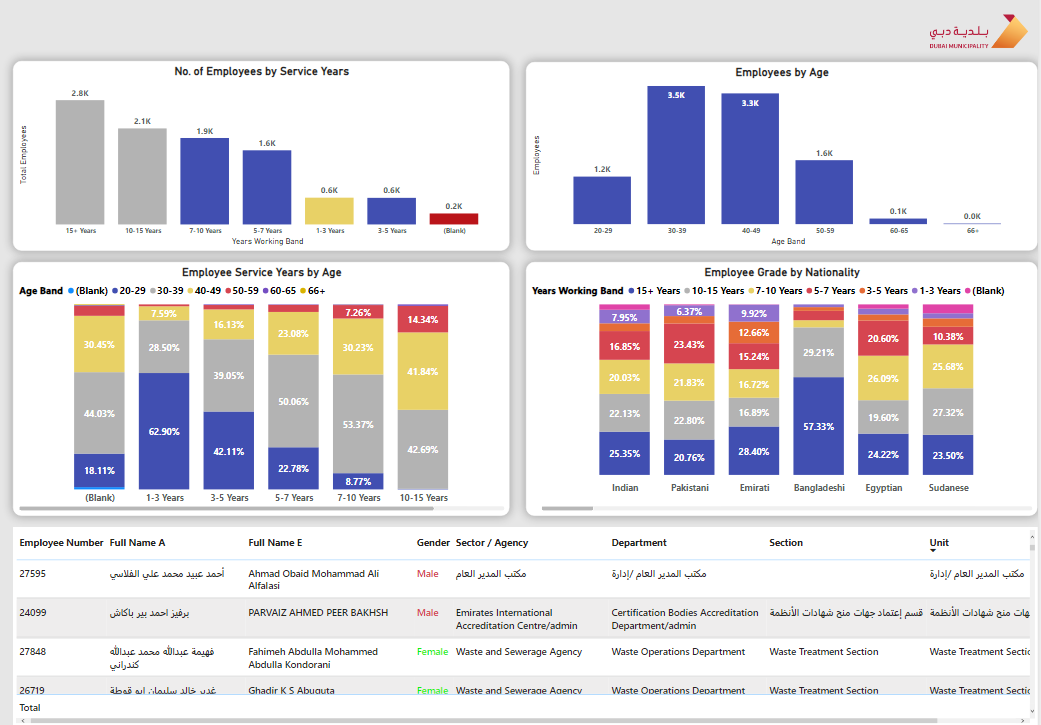
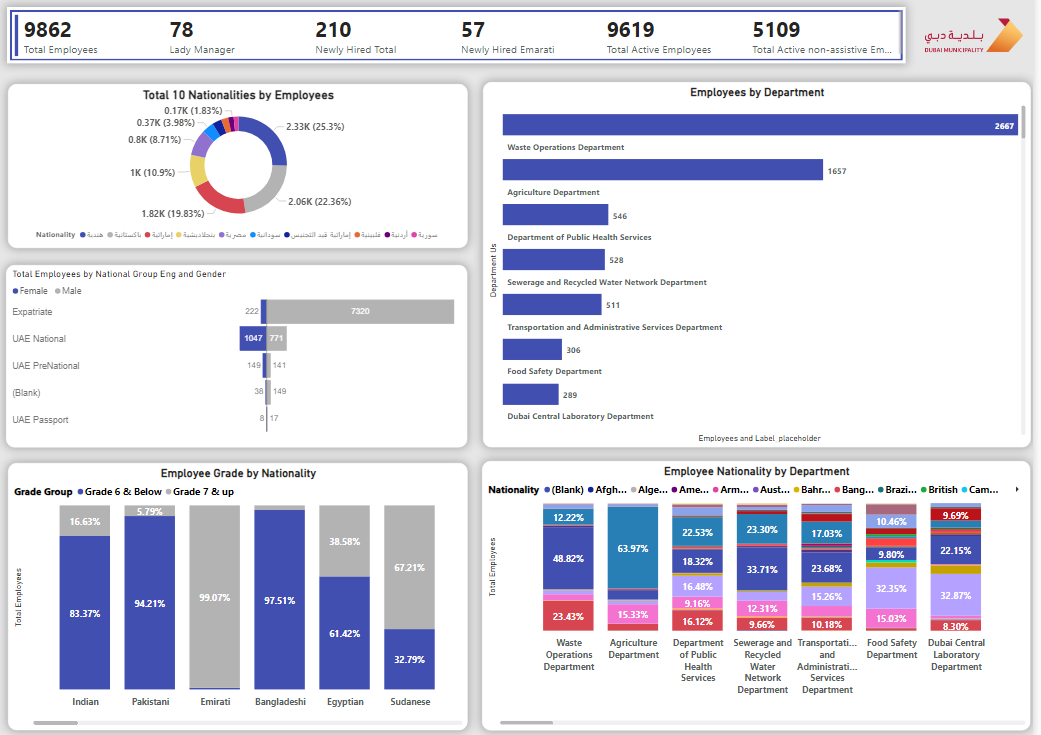
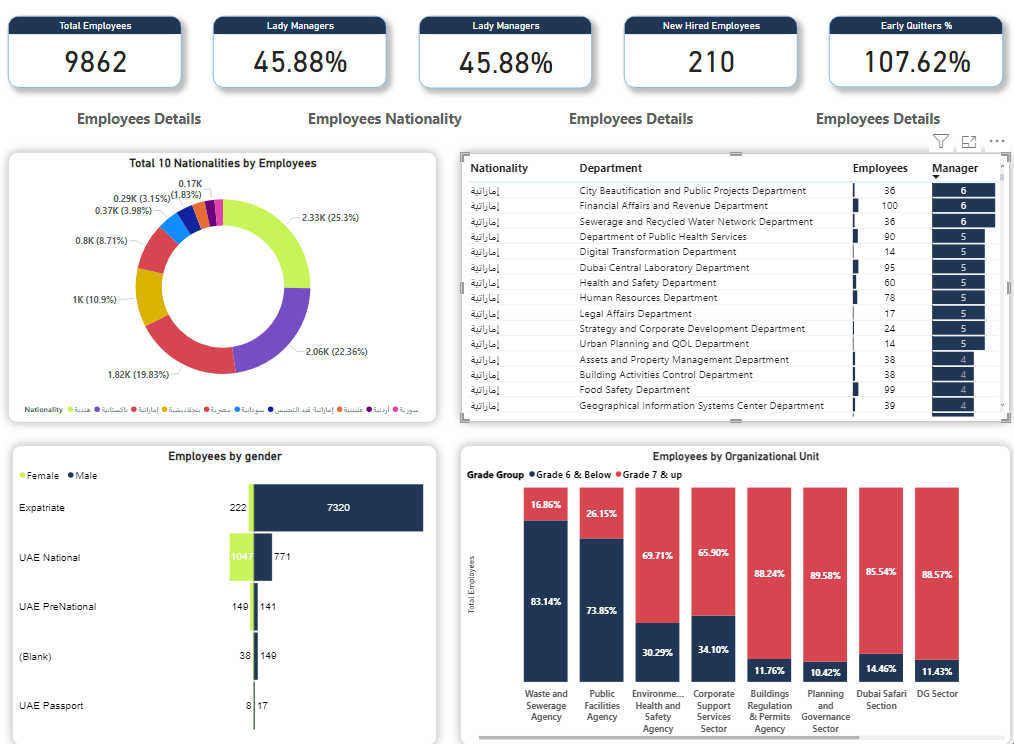
HR Data Analysis and Visualisation
Employees Data Analysis and Visualisation Part-1
Employees Data Analysis and Visualisation Part-2
Employees Data Analysis and Visualisation Part-3
TECHNOLOGIES USED

MS Power BI
MS Excel
